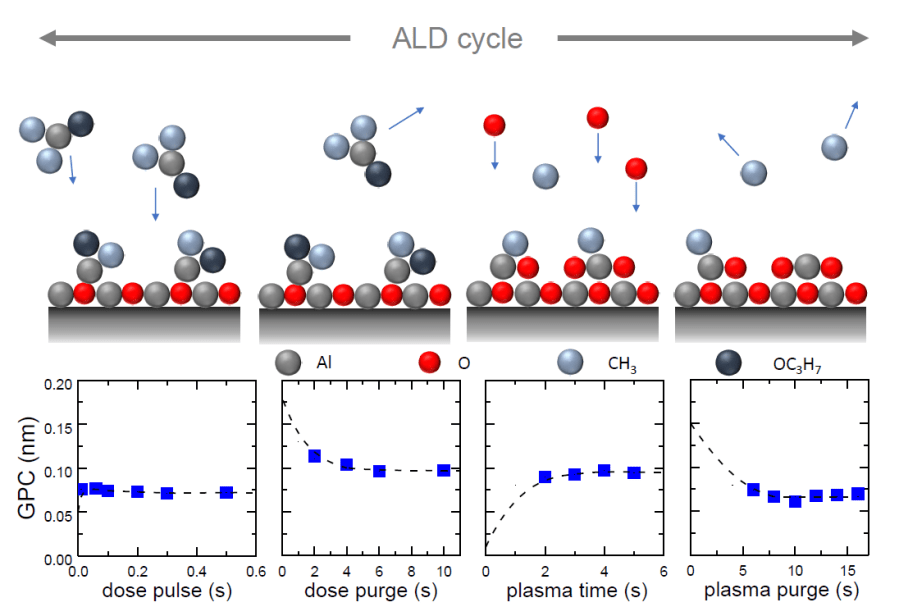
When developing an ALD recipe on new material, it is common to use the growth per cycle (GPC) to determine the completion of the surface chemical reaction. This is critical for the ALD process for reducing the usage of precursor and minimising the process time. Here, we use the non-pyrophoric aluminium precursor, dimethyl aluminium isopropoxide (DMAI), and oxygen plasma as an example for PE-ALD recipe development. The growth of the Al2O3 film was monitored by in-situ spectroscopic ellipsometry. To avoid CVD-like growth during the ALD process, various durations of one ALD step were tested while the other three variables are kept as constants. The GPC as a function of the step duration for the PE-ALD process is shown in the above figure.
In the first step, the dosage of the precursor (in gas phase) is controlled by an ALD pulse valve which opens and closes repeatedly in a short period. This pulse time determines the dosage of the precursor introducing into the reactor. A decrease of GPC could be seen when the dose pulse time is lower than 0.2 s due to the insufficient coverage of precursor on the surface. When the dose pulse time was higher than 0.2 s, a saturated growth is reached. Further increase in the precursor dosage would not result in a higher growth rate of the film. This is vital for the ALD process to minimise the consumption of the precursor (overdosing).
The next step is to purge the chamber to evacuate the residual precursor in the chamber after the precursor dosing step. For purging times < 6 s, the increase of GPC was attributed to CVD-like growth, indicating that the redundant precursor remains in the chamber when the oxidant is introduced. This CVD-like growth is unwanted for the ALD process as the growth of the film is no longer in mono-layer, which affects the film quality.
The optimisation of oxidation steps (oxidation and purging) is similar to the previous steps. The plasma exposure time does not show a significant impact on the GPC and this is due to the high oxidation strength of the oxygen radicals in an oxygen plasma. This indicated a 2 s plasma exposure time was sufficient to complete the reaction as well as the following purge step.